

The C-suite executives and sales leaders must swiftly make decisions and exhibit agile thinking. However, this becomes challenging when faced with an overwhelming array of data entries. This is where Reports and Dashboards come into play.
They enable you to tailor your display to highlight crucial metrics, particularly those vital for various business units and departments. As a result, they prove invaluable for promptly addressing matters that require immediate attention.
Reports used by sales team
To make the most of your sales data, sales teams strategically choose the right kind of report to view and analyze their data.
This kind of intentional approach helps them to pull insights and meaningful information, instead of dealing with an overwhelming pile of data.
Through the capabilities of Tenetizer Technologies, we have distilled a list of 11 essential reports that offer business owners and sales leaders a comprehensive perspective of their operations.
Instances of crucial Reports and Dashboards utilized by teams to assess Sales Productivity include:
Salesforce provides you the ease to set up and view your data in any of these forms of reports, provided you know the right way to analyze different types of data.
- Lead Volume by Source
Key metric: The report shows the number of leads collected during a specific period of time from different sources.
Why it’s important: Marketers tend to use many platforms to generate leads (MQL), be it social media, content marketing, or pay-per-click ads. There are always some sources that generate more leads than others and this report helps to identify that.
- Lead Generation versus Conversion
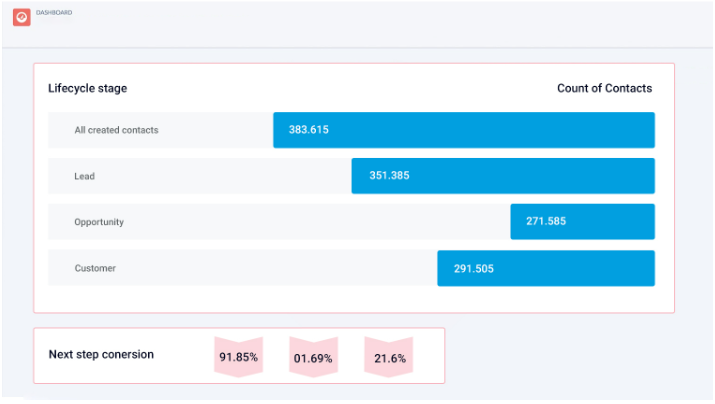
Key Metric: This report provides a breakdown of the total number of leads successfully converted compared to the overall number of leads generated within specific time frames such as days, months, years, or quarters. Additionally, it offers insights into leads sourced from various channels.
Significance: This information is crucial in comprehending the effectiveness and returns on investment for leads acquired through different channels that a business allocates resources to.
- Churned Customers Report
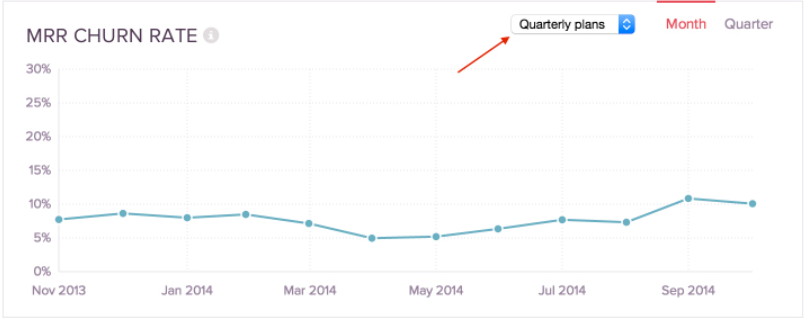
Key Metric: This report aids in pinpointing the areas and sources responsible for customer loss, allowing you to analyze churn by specific factors such as salespersons, industries, or products.
Significance: The churn report plays a vital role in proactively addressing various sources of churn, whether it be inefficient sales processes, industry-specific pain points, or product offerings, ensuring timely resolution and customer retention.
- Sales closed by account managers
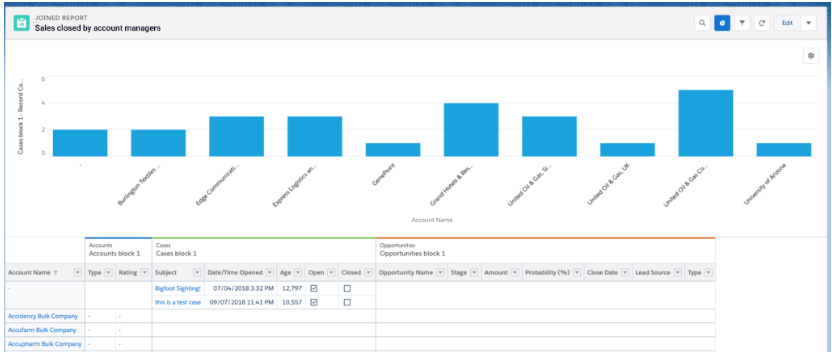
Key Metric: This report monitors the number of opportunities won by individual Account Managers and the cumulative sales value generated by each manager within a specified time frame, considering various parameters such as industries and products.
Furthermore, it allows for the calculation of sales value on a quarterly, half-yearly, and yearly basis, enabling month-over-month and year-on-year comparisons.
Significance: This information guides decisions on providing support to managers who may require additional assistance and acknowledging those who excel, possibly warranting a bonus. It also facilitates the collection of feedback from top-performing account managers. Additionally, the report offers teams an opportunity to review lead distribution for optimization purposes.
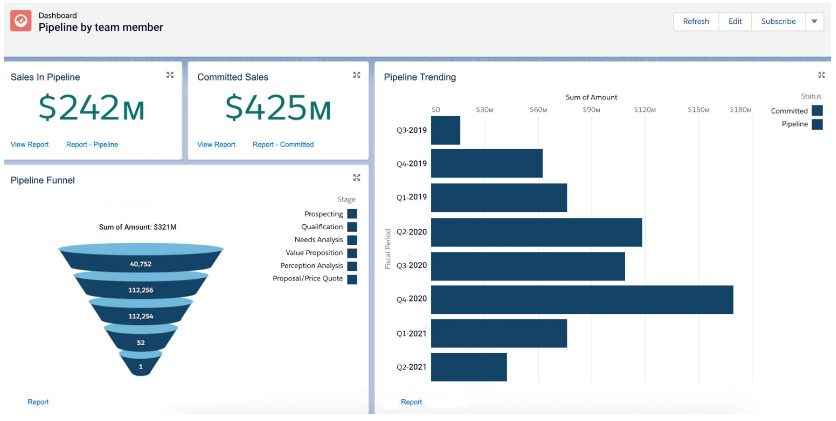
- Pipeline by team member
- Month-wise sales revenue
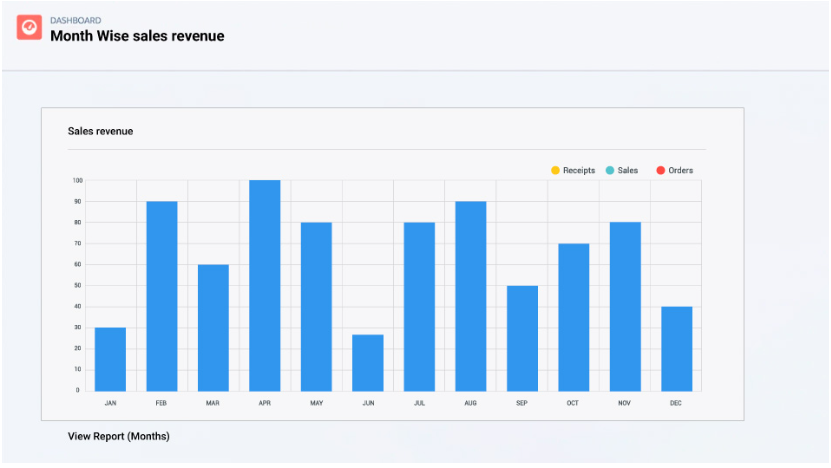
Key Metric: Tailored to specific criteria, this report displays the revenue generated by a particular department, a group of business units, or the entire organization.
Significance: This report is crucial for conducting month-over-month comparisons of revenue across different business units. Additionally, it provides insights into the most pivotal months of the year for sales teams in various units, aiding in the strategic planning of annual leave schedules, identifying peak selling periods, and coordinating other important events.
- Typical conversion rates report
Key Metric: This report illustrates the average conversion rates observed among various team members, business units, or company-wide.
Significance: It offers valuable insights into the proficiency of team members or business units in turning prospects into leads and leads into customers. Additionally, it gauges the effectiveness of both individual and overarching strategies. This report serves as a valuable tool for teams to pinpoint areas of weakness within the sales cycle.
- Average deal size report report
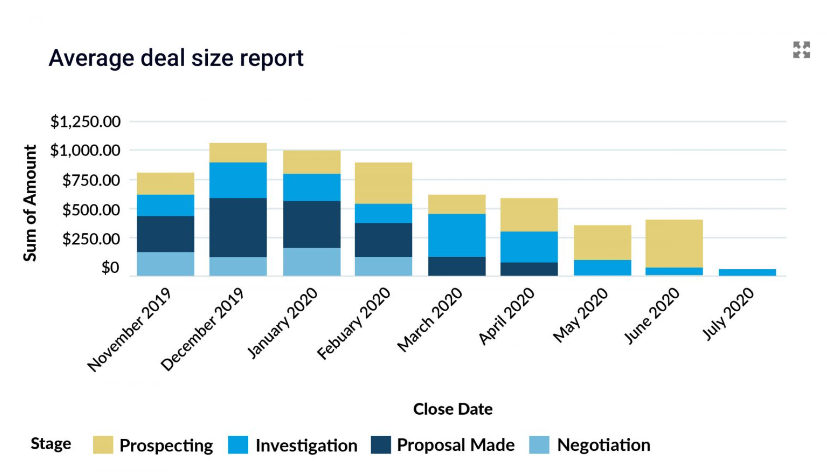
Key Metric: This report tracks the average deal sizes over a recent period, categorizing them by industries, business units, and sources. It aids in monitoring sources with smaller deal sizes.
Significance: This analysis assists in recognizing areas where business units, industries, or products may need to enhance their cross-selling efforts, refine pricing strategies, or package offerings more effectively. Moreover, it provides a foundation for establishing expectations and milestones for sales quotas to be taken into account in the upcoming sales cycle.
- Win rates
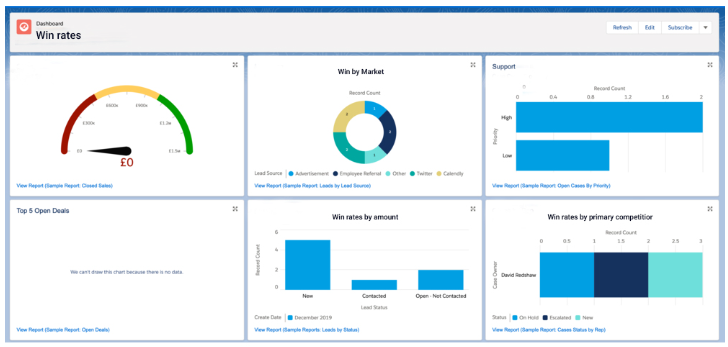
Key Metric: This report presents the ratio of won opportunities to the total number of opportunities.
Win rates can be computed and contrasted for individual team members, teams, business units, target industries, products, and service offerings.
Significance: In the fiercely competitive world of sales, where representatives strive to maximize their bonuses, win rate data empowers them to proactively manage their pipelines and maintain a strategic advantage.
- Lost opportunities by reason
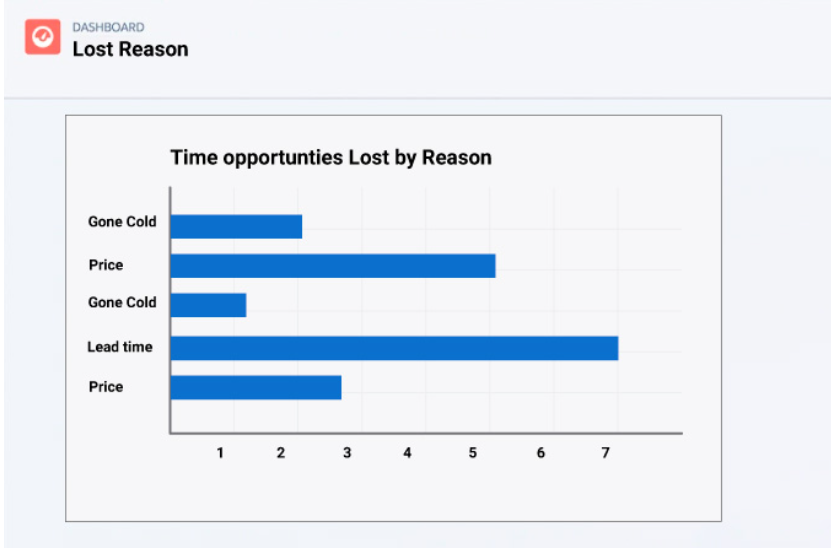
Key Metric: This report displays all lost opportunities along with their respective reasons.
Significance: Understanding buyer motivation is crucial for maximizing sales. By tracking the specific reasons for lost opportunities, sales representatives gain valuable data-driven insights into buyer behavior. This information can be leveraged to offer services and products that align better with potential buyers’ preferences and needs.
- Target Sales versus Actual Sales Report
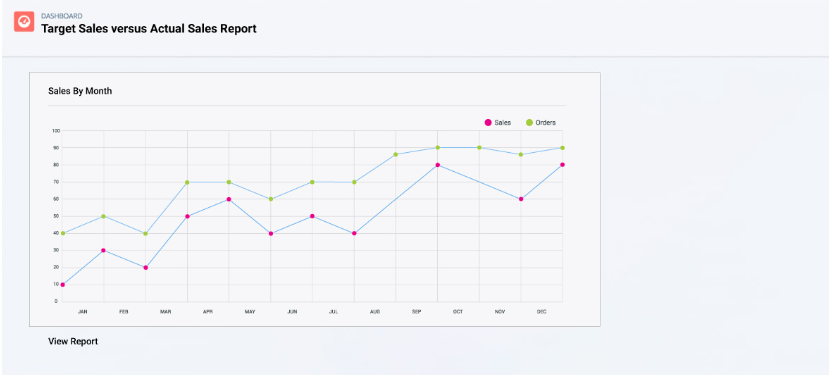
Key Metric: This report monitors monthly sales in comparison to the targeted sales for each month, providing insights into months with deviations from targets and those with peak sales performance.
Significance: It informs business units about months that require additional sales opportunities and leads in the pipeline to maintain consistent sales figures.
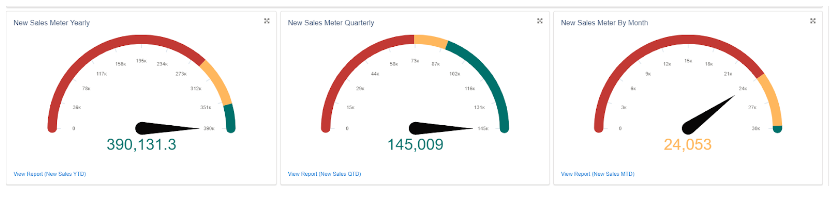
This report can be examined in conjunction with yearly, quarterly, and monthly sales metrics to assess overall sales performance.
Wrapping up
At Tenetizer Technologies, we’ve adeptly introduced a range of tailored and conventional reports and dashboards, finely tuned to suit the distinct strategies and requirements of sales teams. Drawing from our extensive experience, it’s evident that this implementation has significantly expedited decision-making for our clients, leading to tangible enhancements in their sales processes. For personalized assistance and guidance tailored to your specific needs, feel free to reach out to us at contact@tenetizer.com. Let’s work together to enhance your sales processes and drive success!